Open Interest shows the total count of open or outstanding contracts presently in the market participant at a given time. Open Interest analysis is very great way to identify market trend
Table of Contents
What is OI or Open Interest and how to understand it?
Lets take an example suppose there are four traders or participants in the market named A, B, C, D and E
- On 1st Jan, A buys 10 contracts from B therefore OI 10
- 2nd Jan C buys 20 contracts from D therefore OI 30
- 3rd Jan A sells his 10 contracts to D therefore OI 20
- 4th Jan E buys 20 contracts from C therefore OI 20
So, we now understood how OI changes depending on market sentiment.
OI Interperation
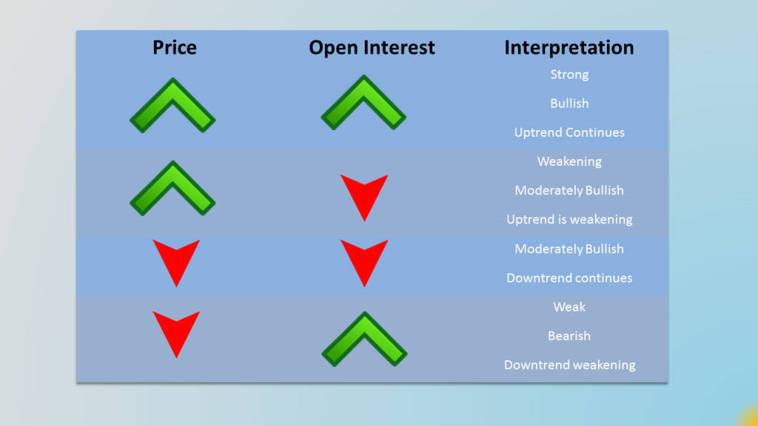
- When OI increases and asset price increases then market is bullish
- When OI decreases and asset price increases then market is weakening
- When OI decreases and asset price decreases then market is bearish or downtrend
- When OI increases and asset price decreases then market is either Weak or bearish or in Downtrend
Understand the OI Interperation with below image effectively.
How to Analye OI data?
A trend is what? its defined when price goes up or down, but the sustainability of that trend is indeed questionable. There are some important factors that help us understand the future movement such as above OI Interpretation, also OI data can also help identify a good trend but a trend reversal also.
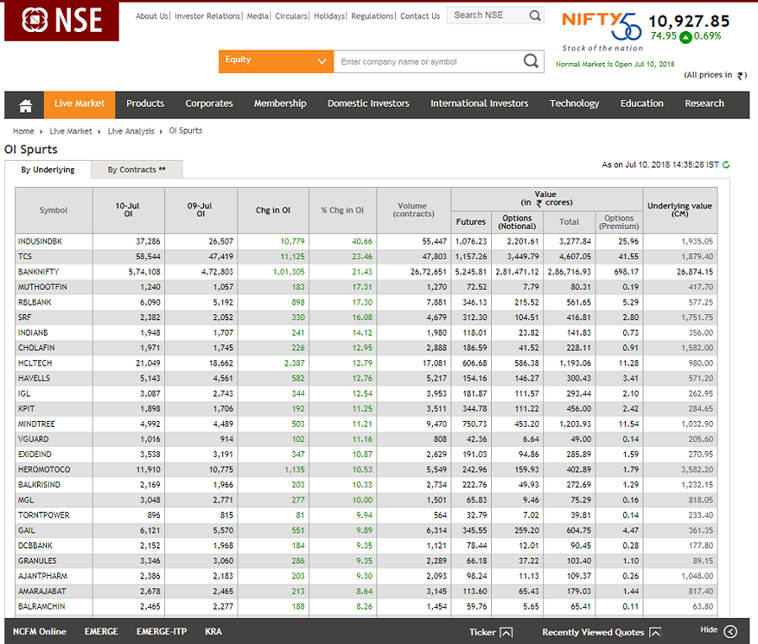
How to find open interest in stocks?
There are many place where you can find OI data of any stock, i recommand you can check NSE (National Stock exchange), here is the link you can get last day's OI Data as Shown in figure below.
How to understand Option Chain
The option chain of any stock provides us a great understaning of how trader have place their bids, Normally participants with large capital usally Sell the contracts called Option Seller while with limited capital usally Buy called Option Buyer.
We must know that option seller have an advantage of time decay or theta decay.
Suppose if there gap up or gap down opening in the market to the OI build up then unwinding of the open interest pushed the market even more in gap up or gap down.
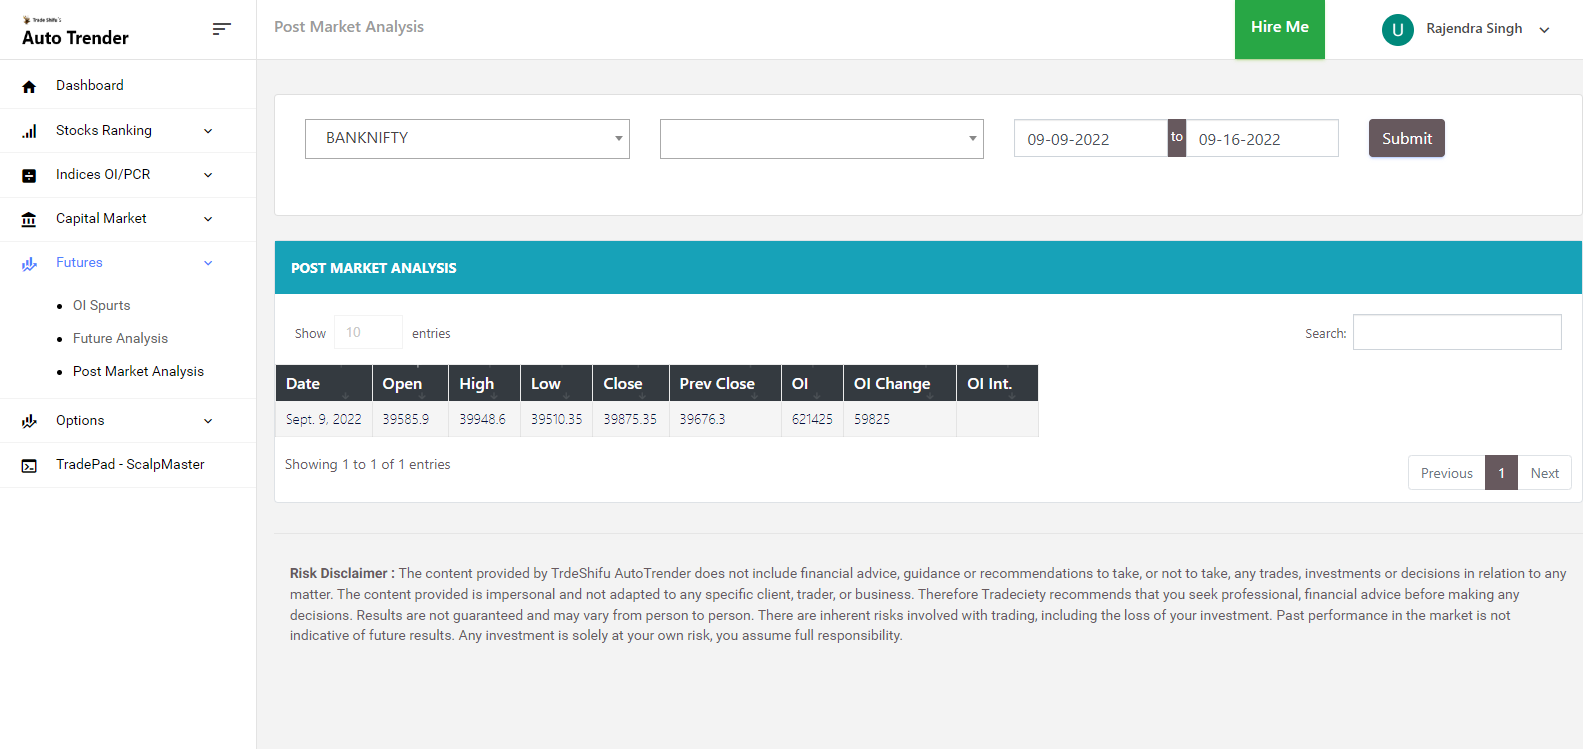
How to use OI data using TradeShifu Auto Trender?
TradeShifu Auto Trender has a feature called Post Market Analysis where you can check out current market session or previous OI to identify the market trend or sentiment.
Watch out our Auto Trender walkthrough video on YouTube.