There is alot of strategies to trade the market one of them is Volume Profile, Traders mostly look for opportunity where big players are trading to get high probability trade and that is where you can use Volumes Profile to identify the potential breakout or breakdown.
A Volume Profile is nothing but a bar graph with number of trade or volume took placed at a sepecific price over a specified period.
In Today's post i am going to teach you how you can use it with Support Resistance to detect a good Breakout or breakdown.
There is several type of Volume Profile, Session and X or Y Axis is most used Volume Profile indicator among traders.
Table of Contents
What is Volume Profile
Volume Profile roile is an very advanced indicator that shows the total number trades placed in a specified timeframe.
Trade with Support and Resistance
We will first use a Volume Profile to find basic Support and Resistance level, but we should also remenber that using Volume Profile as a Support and Resistance level identifier is reactive.
Unlike proactive methods, The Volume Profile is Reactive this can help assign meaning or significane to price levels that market has already passed through. As we know support levels are those level that will prevent a price to fall and resistance level is a price level that can stop a price on its way up.
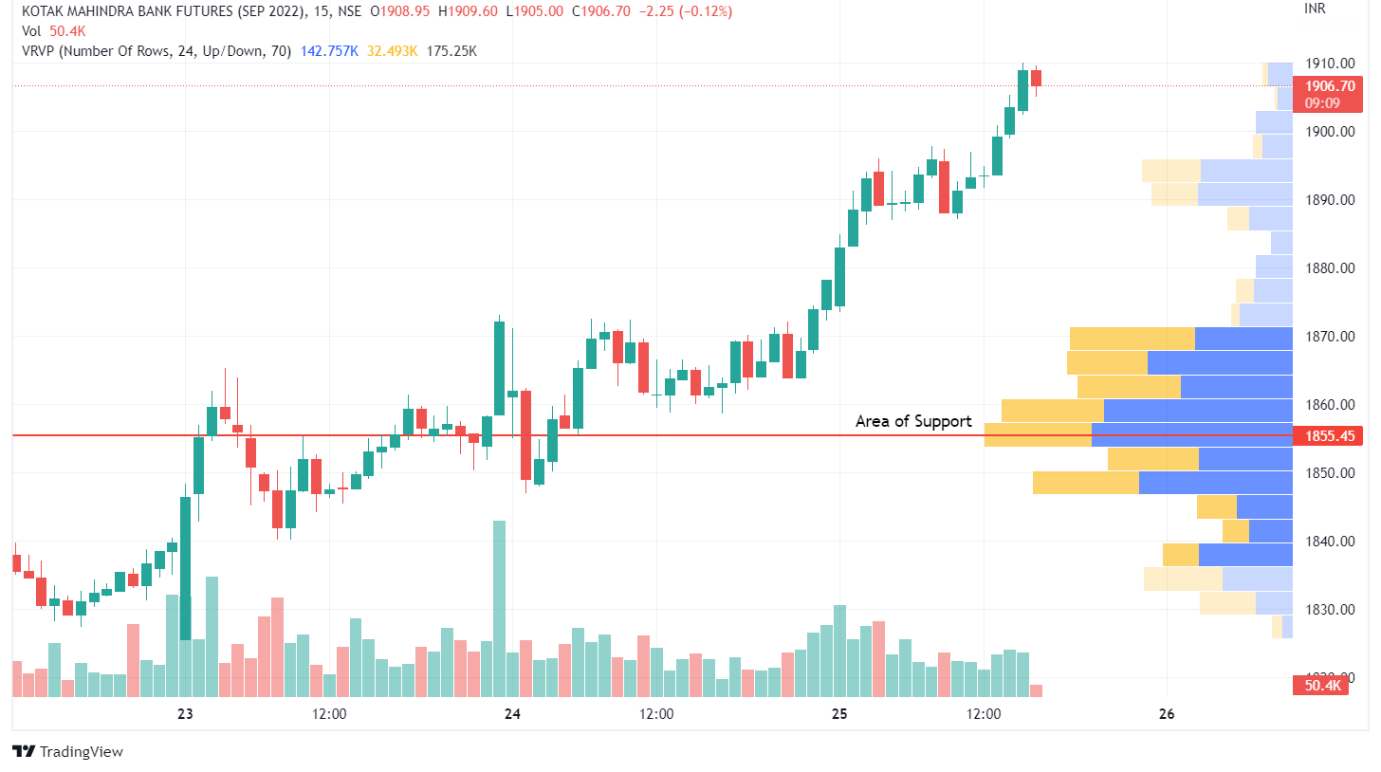
A you can see in the above picture a red line is draw with text Area of Support. Its a price level where indicator is favouring the buy side in terms of volume act as Support Level. Same goes with selling side.
Trade with High Volume Nodes and Low Volume Nodes
Components of this type of Volume Profile
Things to Remeber
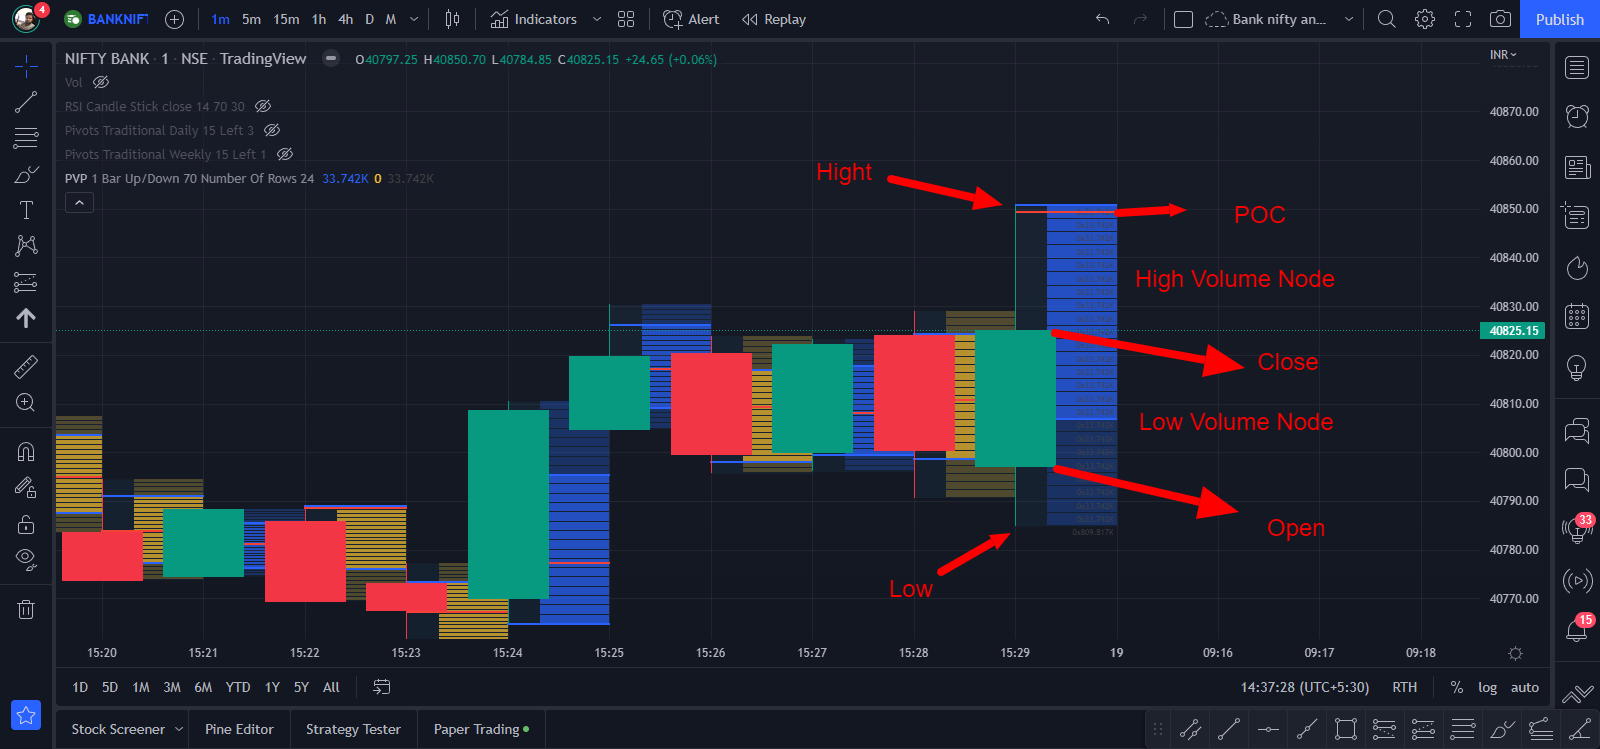
- There is many type of Volume Profile Indicator but majority of them use with OHLC attached, as show in above screenshot.
- POC alse called Point of Control indicates the most traded price for the session.
- High or Low Volume is a Price Range in which user mentioned percentage volume was traded for a session.
Steps to Trade with LVN and HVN
- High Volume Nodes are nothing but a volume peaks. HVN can also be undersood as a sigh of period of consolidation. When compared with other level activities on both side can be found hence market stays at that price for a long time.
- A range bound market is expected when the price move towards last HVN level or fair value area.
- Low Volume Nodes are volume where price most likely to drop to the level. LVN are usualy caused by a breakout or breakdown. Upon an active breakdown rally these is a burst of volume followed by a significant drop follow up.
- They decrease offenly means for "unfair value area". When market move towards a last LVN value its is likely to rally or baounce off that price level.
Conclusion
Volume Profile is very use when combined with Price Action, and its widely used by traders across globe. You can master this Tool and increase your winning rate.