Marc Chaikin was the creator of accumulation/distribution line, its used to determine the flow of money into or out of any security. It help us identify the divergences between volume and stock price or emerging trend. Accumulation and distribution line uses price and volume to identify whether the stock is accumulated or distributed. It sometime can confuse Advance/decline indicator but they are different.
Table of Contents
the formula of Accumulation/Distribution for indicator
CLV = (C-L) - (H-C) / H - L
where:
C = closing price
H = high of price range
L = low of price range
This indicator also available in Trading View with name Accumulation/Distribution.
What is Accumulation and Distribution Line Indicator?
Accumulation and Discribution Line Indicator is a volume based indicator, used to determine the flow of money or out of security to identify the trend of the stock, in the case the term "accumulation" means level of buying (demand zone) while distribution means level of sellling (supply zone). We can forecast the stock's future based on these supply and demand zone.
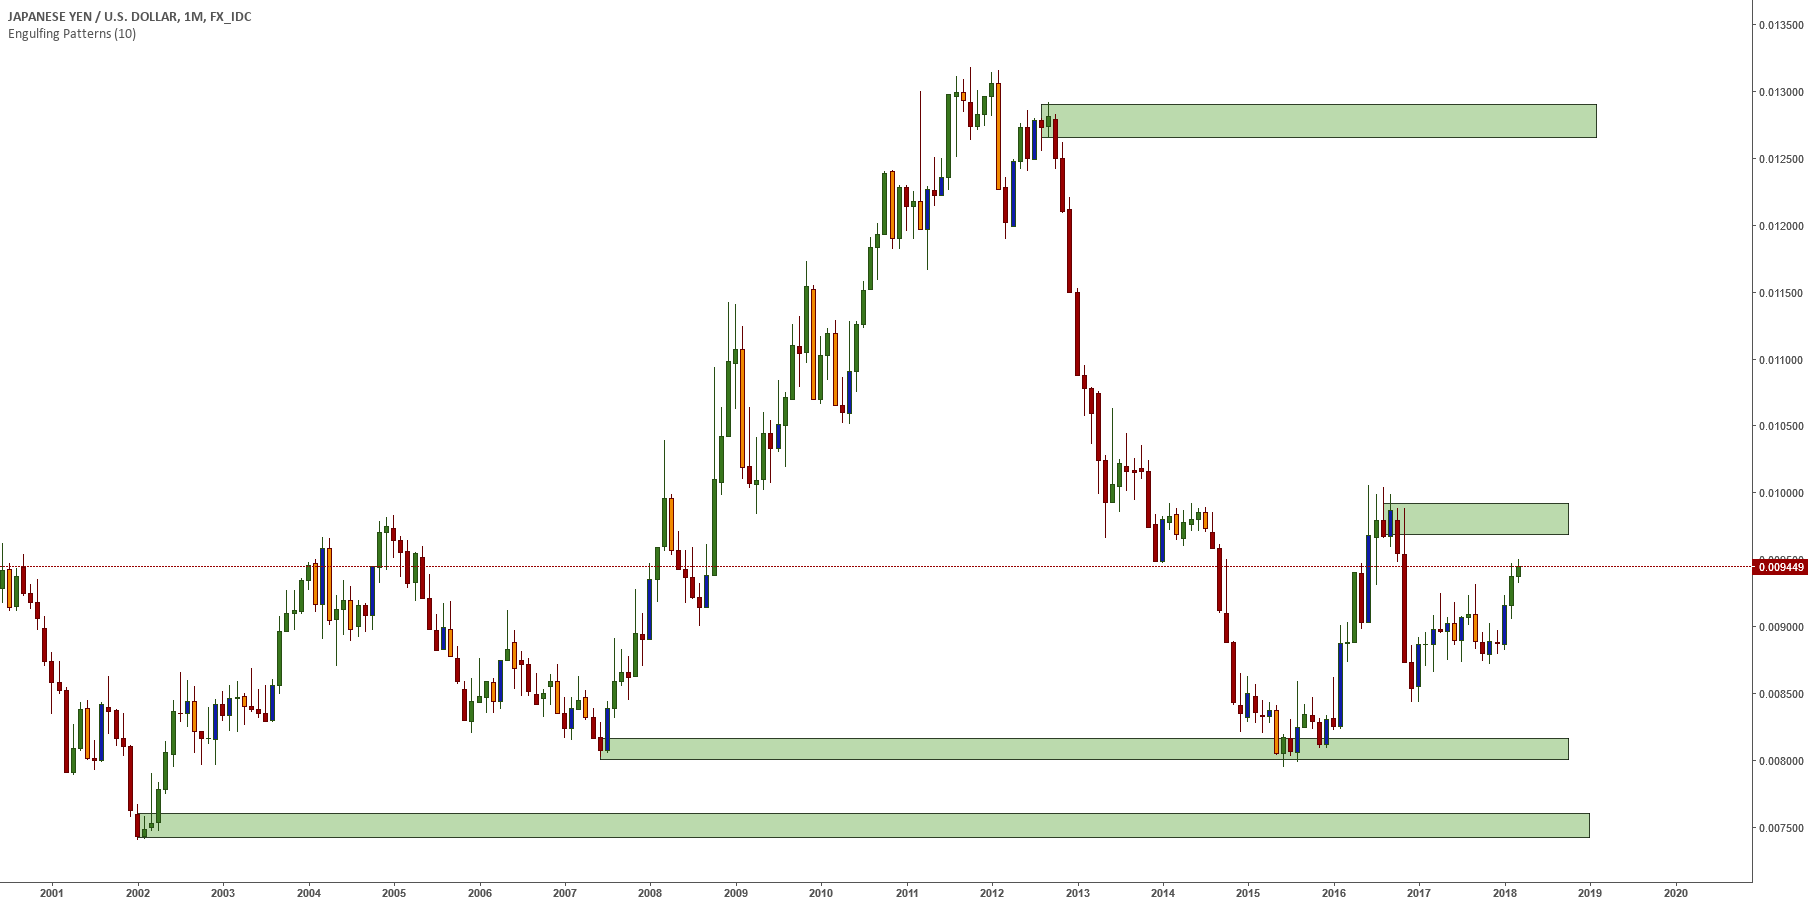
How to find Supply and Demand Zone Manually?
In the below image as you can some level are market from where Supply and Demand pressure were emerged hense currency(JPY/USD) price moved extensively.The Zones marked below the current price of asset is called Demand Zone and if the zone if above current price of asset is Supply Zone. It can also be called as Support or Resistance.
How to trade with the Accumulation and Distribution Line Indicator?
The main rule of this indicator is that volume comes before the price and the number of traded shares is directly proportional to the stock price rising and failing.
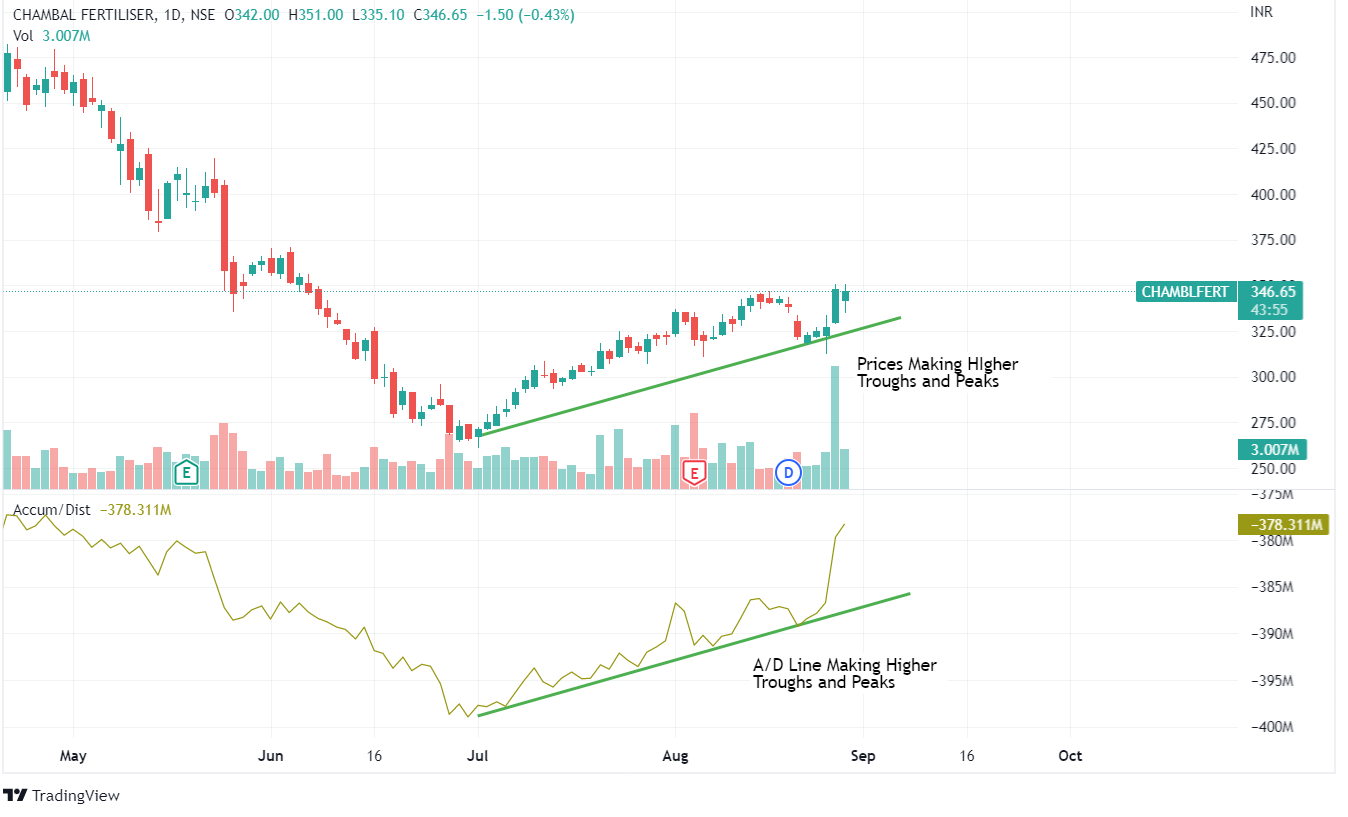
- As we can see trend is up and indicator also making higher peaks.
- When the A/D line start increasing then there may be accumulation in the stock and it may break out in the up direction
- During the range market A/D line start descending and it may be said to be a distribution in the stock.
- If A/D Line makes lower highs and prices make higher highs, then it might be a negative divergence, and the stock may reverse to a downtrend.
- IF A/D Line makes higher highs and prices make lower highs, then we may there is positive divergence, and the stock may reverse to an uptrend.
Conclusion
Now we know about Accumulation and Distribution Line and how to Identify potential future movement that will surely increase our trade accuracy.