A volume indicator is a technical indicator that uses volume data to provide insight into the strength of a trend or the likelihood of a reversal. The most common volume indicator is the on-balance volume (OBV) indicator. This indicator uses volume data to calculate a cumulative total of volume, which is then plotted as a line on a chart. The OBV line can be used to confirm price movements or to identify potential price reversals.
Table of Contents
There are other volume indicators as well, such as:
-
On-Balance Volume (OBV): uses volume data to calculate a cumulative total of volume, which is then plotted as a line on a chart.
-
Chaikin Money Flow (CMF): uses both price and volume data to measure buying and selling pressure.
-
Volume-Weighted Average Price (VWAP): calculates the average price of a security based on volume, rather than time.
-
Accumulation/Distribution Line (A/D) : measures the net flow of money into or out of a security by comparing the closing price to the high and low prices for the period.
-
Volume Oscillator: compares the current volume to a moving average of volume over a certain period of time.
-
Volume-Price Trend (VPT): uses both volume and price data to measure buying and selling pressure.
-
Volume Profile : shows the distribution of volume at different price levels.
-
Volume Rate of Change (VROC): measures the rate of change of volume over a certain period of time.
-
Volume-based Moving Averages: applies a moving average to volume data to identify trends in volume over time.
On-Balance Volume (OBV)
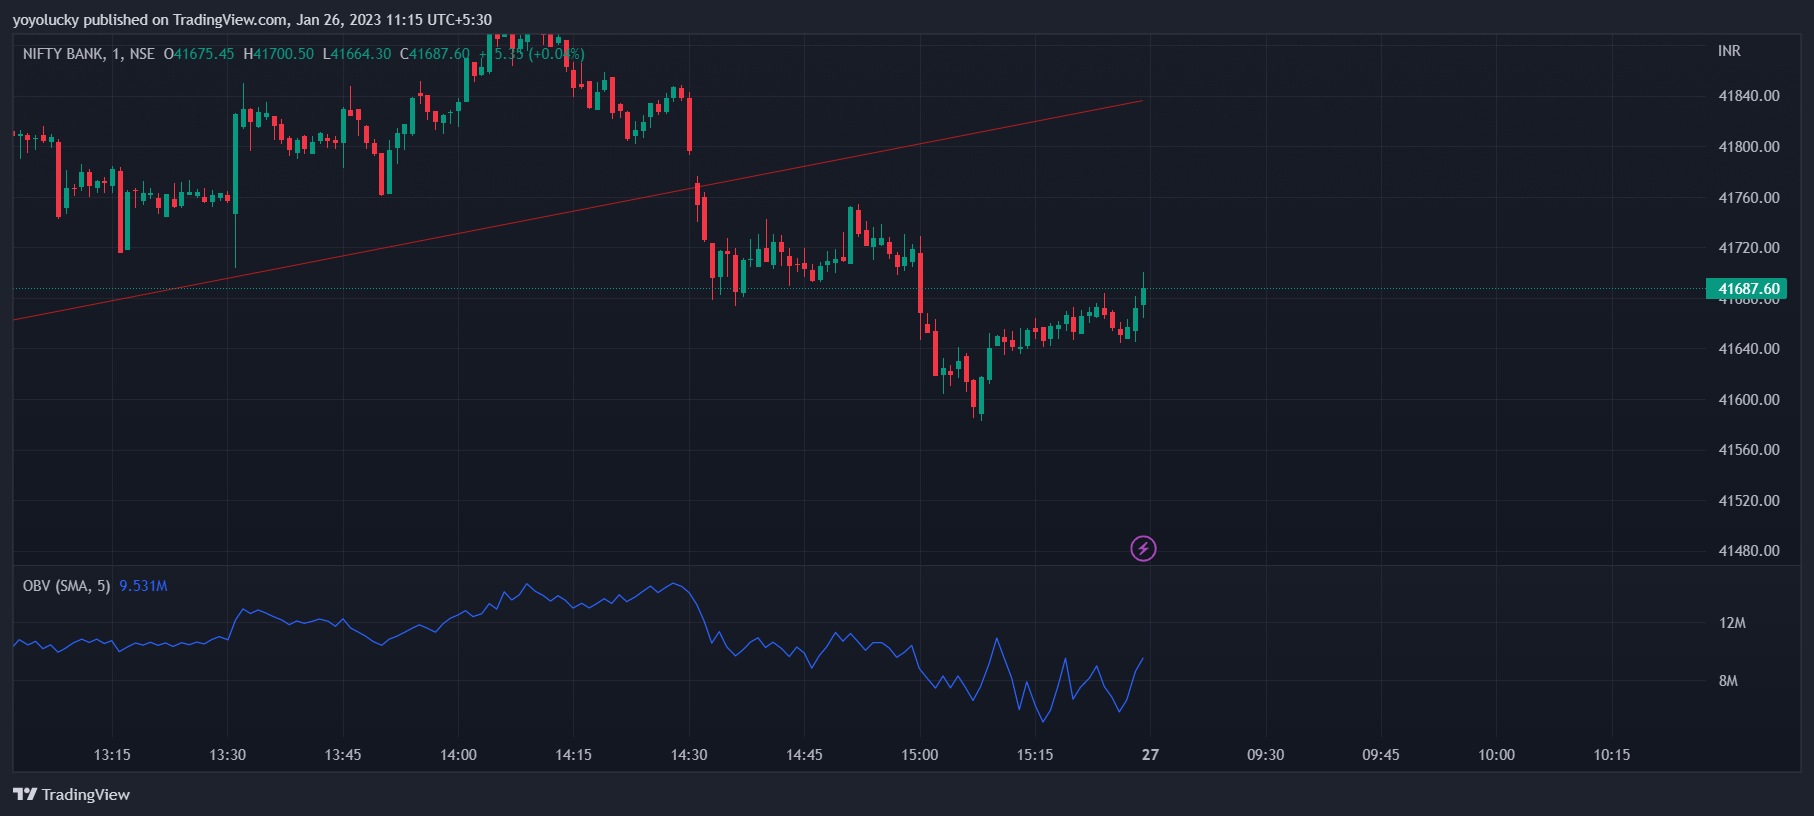
On-Balance Volume (OBV) is a technical indicator that uses volume data to provide insight into the strength of a trend or the likelihood of a reversal. The OBV indicator uses volume data to calculate a cumulative total of volume, which is then plotted as a line on a chart. The OBV line can be used to confirm price movements or to identify potential price reversals.
The OBV indicator is calculated by adding the volume of a security on up days and subtracting the volume of a security on down days. The cumulative total is then plotted as a line on a chart. A rising OBV line indicates that volume is flowing into the security, which confirms a bullish trend. A falling OBV line indicates that volume is flowing out of the security, which confirms a bearish trend.
It's important to note that OBV is a momentum indicator, meaning that it's best used to confirm price movements and not as a standalone indicator. It's also important to use OBV in conjunction with other indicators and analysis, such as trend lines or moving averages, to gain a better understanding of the market. Additionally, OBV is a lagging indicator, meaning it will not provide signals in real-time, but rather after a trend has already begun.
How to trade with On-Balance Volume (OBV)
On-Balance Volume (OBV) can be used to generate buy and sell signals in several ways:
-
Crossover: A buy signal is generated when the OBV line crosses above a moving average or a trend line, indicating that volume is flowing into the security and confirming a bullish trend. A sell signal is generated when the OBV line crosses below a moving average or a trend line, indicating that volume is flowing out of the security and confirming a bearish trend.
-
Divergence: A buy signal is generated when the OBV line is making new highs while the security is not, indicating a potential reversal. A sell signal is generated when the OBV line is making new lows while the security is not, indicating a potential reversal.
-
Breakout: A buy signal is generated when the OBV line breaks out above a resistance level, indicating a strong bullish trend. A sell signal is generated when the OBV line breaks out below a support level, indicating a strong bearish trend.
It's important to note that OBV is a momentum indicator and is best used to confirm price movements and not as a standalone indicator. It's also important to use OBV in conjunction with other indicators and analysis, such as trend lines or moving averages, to gain a better understanding of the market. Additionally, OBV is a lagging indicator, meaning it will not provide signals in real-time, but rather after a trend has already begun. As with any trading strategy, it's always recommended to use proper risk management techniques and have a clear stop-loss strategy.
It's important to keep in mind that volume indicators are not standalone indicators and are best used in conjunction with other analysis and indicators to confirm price movements or potential reversals. It's also important to note that volume indicators are used mainly in stock markets, not in all financial markets.