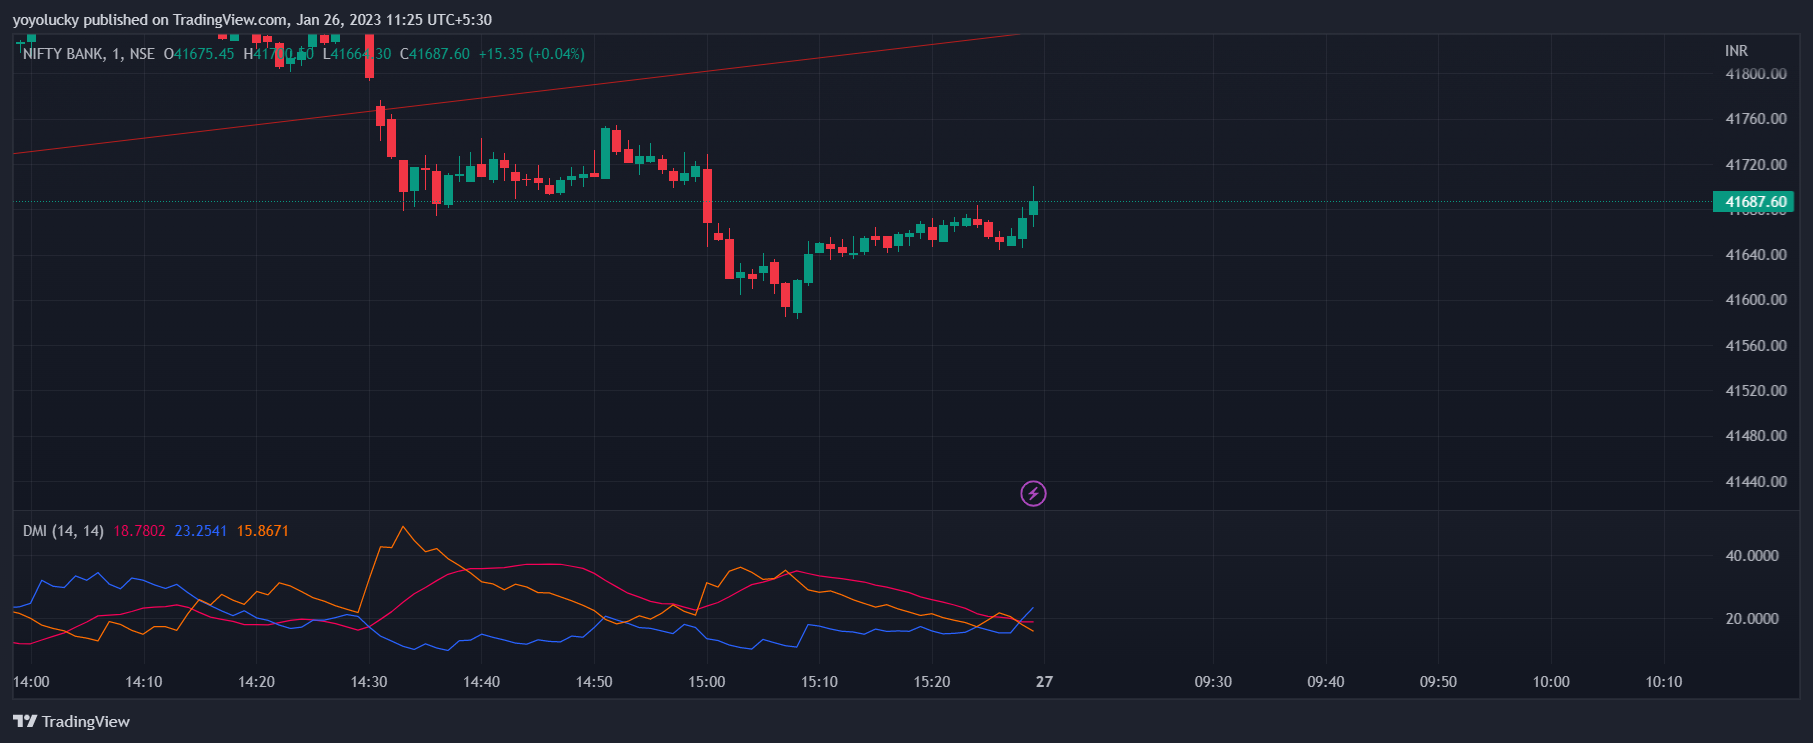
The Directional Movement Index (DMI) is a technical indicator used in the analysis of financial markets to determine the strength of a trend in a security or currency. It is composed of two lines, the Positive Directional Indicator (+DI) and the Negative Directional Indicator (-DI), which are used to measure buying and selling pressure, respectively. The DMI also includes the Average Directional Index (ADX), which is a measure of trend strength. The DMI is used to determine the strength of a trend, whether it is bullish or bearish, and can also be used to generate buy and sell signals.
Table of Contents
How to Trade with Directional Movement Index (DMI)
The Directional Movement Index (DMI) can be used to generate buy and sell signals in several ways:
-
Crossover: A buy signal is generated when the +DI line crosses above the -DI line, indicating that the bullish trend is becoming stronger. A sell signal is generated when the -DI line crosses above the +DI line, indicating that the bearish trend is becoming stronger.
-
ADX: A buy signal is generated when the ADX line is rising and is above a certain level, indicating a strong trend. A sell signal is generated when the ADX line is falling and is below a certain level, indicating a weak trend.
-
Divergence: A buy signal is generated when the +DI line is making new highs while the security is not, indicating a potential reversal. A sell signal is generated when the -DI line is making new lows while the security is not, indicating a potential reversal.
It's important to note that, DMI is a trend-following indicator, so it is best used in conjunction with other indicators or analysis for confirmation. Also, DMI is a lagging indicator, meaning it will not provide signals in real-time, but rather after a trend has already begun. It's always recommended to use proper risk management techniques and have a clear stop-loss strategy.