Swing trading is a strategy that involves holding positions for several days to capture medium-term price movements. Swing traders use technical analysis tools, such as indicators, to identify potential buying and selling opportunities. Some common swing trading indicators include:
-
Moving averages : used to smooth out price action and identify trends.
-
Relative Strength Index (RSI) : a momentum indicator that compares the magnitude of recent gains to recent losses.
-
Fibonacci retracements : a technical analysis tool that uses horizontal lines to indicate areas of support and resistance at the key Fibonacci levels.
-
Bollinger Bands : a volatility indicator that consists of a moving average and two standard deviation lines.
-
Relative Vigor Index (RVI) : a momentum indicator that compares the closing price of a security to the range of prices over a set period.
-
Candlestick patterns : specific patterns formed by the opening, closing, high and low prices of a security over a specific period.
Table of Contents
What is Relative Vigor Index (RVI)
The Relative Vigor Index (RVI) is a momentum indicator that compares the closing price of a security to the range of prices over a set period. It is designed to identify changes in buying and selling pressure, which can indicate potential trend reversals.
The RVI is calculated by dividing the difference between the current closing price and the previous closing price by the sum of the current closing price and the previous closing price. The resulting value is then smoothed using an exponential moving average.
The RVI has two lines, the RVI line and the signal line. The RVI line is calculated using the current and previous closing prices, while the signal line is a moving average of the RVI line.
Traders can use the RVI to identify potential buying and selling opportunities by looking for divergences between the RVI and the price of the security. A bullish divergence occurs when the RVI is making new highs while the security's price is making new lows, and a bearish divergence occurs when the RVI is making new lows while the security's price is making new highs.
It's important to note that the RVI is a momentum indicator and may not always be accurate in predicting future price movements. Traders should use the RVI in conjunction with other analysis methods, such as chart patterns and indicators, to confirm trading signals. It's also important to adjust the parameters of the RVI according to the security or market conditions to get more accurate results.
What is Fibonacci retracements
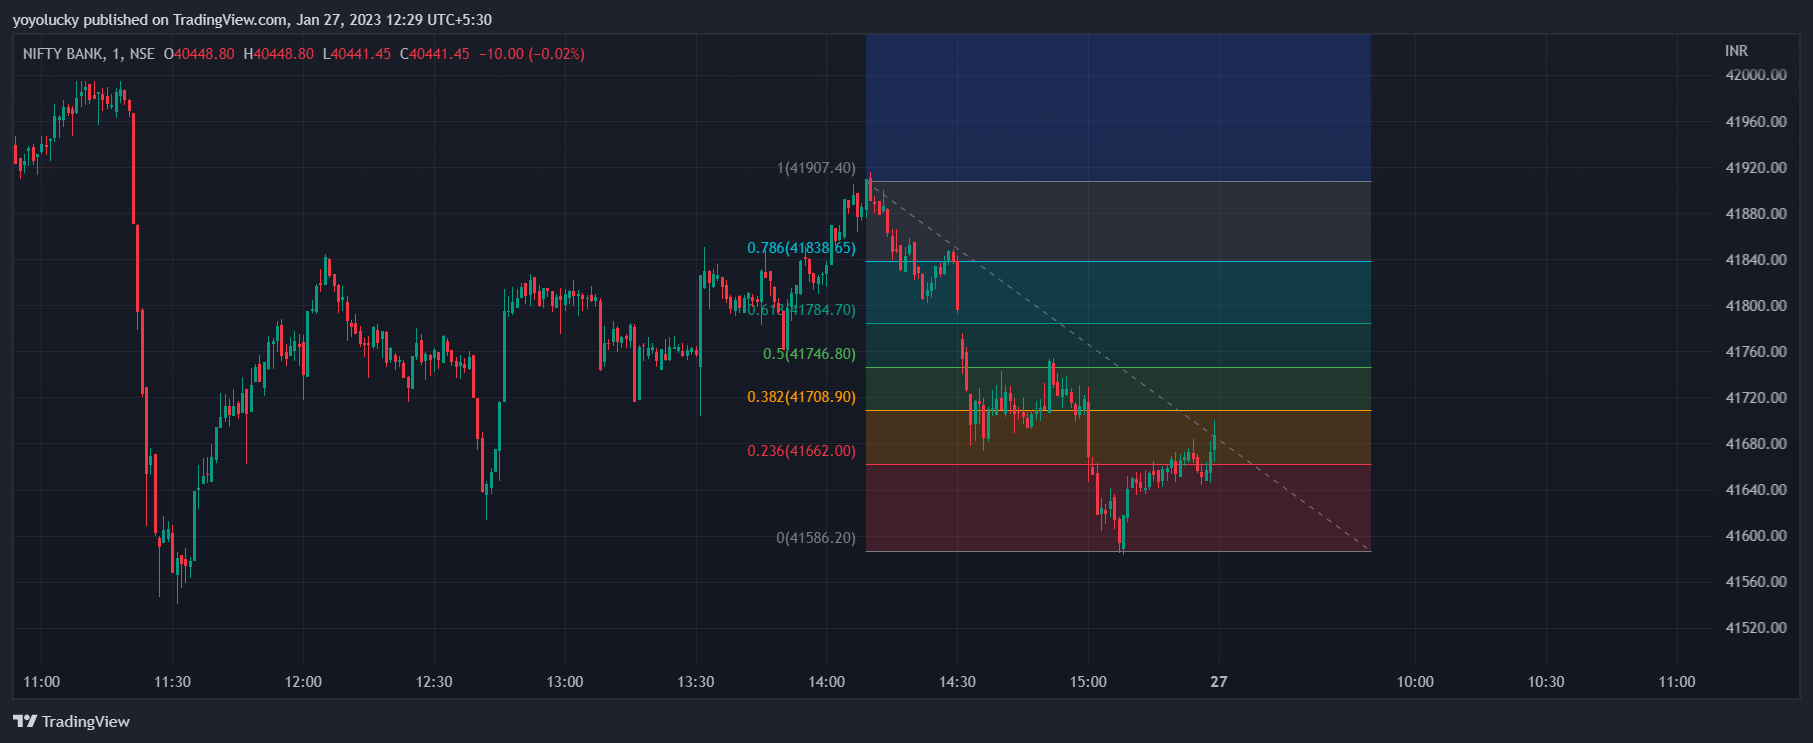
Fibonacci retracements are a technical analysis tool that uses horizontal lines to indicate areas of support and resistance at the key Fibonacci levels. These levels are based on the Fibonacci sequence, which is a series of numbers where each number is the sum of the two preceding ones, typically starting with 0 and 1. The most commonly used levels are 23.6%, 38.2%, 50%, 61.8%, and 100%.
To create Fibonacci retracements, traders first identify a significant high and low point on a chart. They then use these two points to plot horizontal lines on the chart at the key Fibonacci levels. These levels are then used to identify potential areas of support and resistance, where the price may experience a reversal or a pause in its trend.
Traders can use Fibonacci retracements to identify potential entry and exit points. If the price retraces to a key Fibonacci level and then starts to move in the direction of the trend, it can be used as a potential entry point. If the price retraces to a key Fibonacci level and then starts to move in the opposite direction, it can be used as a potential exit point.
Fibonacci retracements can also be used in conjunction with other indicators and chart patterns to confirm trading signals. It's important to note that Fibonacci retracements are a tool of technical analysis and may not always be accurate in predicting future price movements. Traders should use them in conjunction with other analysis methods, such as fundamental analysis and market context to confirm trading signals.
Conclusion
It's important to note that these indicators should be used in conjunction with other analysis methods, such as chart patterns, fundamental analysis and market context to confirm trading signals. It's also important to test the indicator over a period of time and in different market conditions. Swing traders should also be aware of the broader market trends and events that could impact their trades.