Intraday trading indicators are technical analysis tools that traders use to make short-term buying and selling decisions. Some common intraday indicators include:
-
Moving averages : used to smooth out price action and identify trends.
-
Relative Strength Index (RSI) : a momentum indicator that compares the magnitude of recent gains to recent losses.
-
Bollinger Bands : a volatility indicator that consists of a moving average and two standard deviation lines.
-
Stochastic Oscillator : a momentum indicator that compares the closing price to the range of prices over a set period.
-
MACD (Moving Average Convergence Divergence) : a trend-following momentum indicator that displays the relationship between two moving averages of a security's price.
Table of Contents
What is Moving Averages?
Moving averages are a popular technical indicator used in intraday trading to smooth out price action and identify trends.
Trade with Moving Averages
There are several ways to use moving averages in intraday trading:
-
Identifying trends: A moving average can be used to identify the direction of a trend by comparing the relationship between the current price and the moving average. If the price is above the moving average, it is generally considered to be in an uptrend, and if the price is below the moving average, it is considered to be in a downtrend.
-
Crossover signals: A crossover occurs when a short-term moving average (such as a 50-day moving average) crosses above a longer-term moving average (such as a 200-day moving average). This can be used as a buy or sell signal.
-
Support and resistance: A moving average can also act as a level of support or resistance, providing traders with a reference point for their trades.
-
Multiple moving averages: Traders may use multiple moving averages, such as a 5-day, 10-day, and 20-day moving average, to help identify short-term trends and potential buy or sell opportunities.
It's important to note that moving averages work best in trending markets and may not be as reliable in choppy or range-bound markets. Traders should use moving averages in conjunction with other analysis methods, such as chart patterns and indicators, to confirm trading signals.
What is Bollinger Bands?
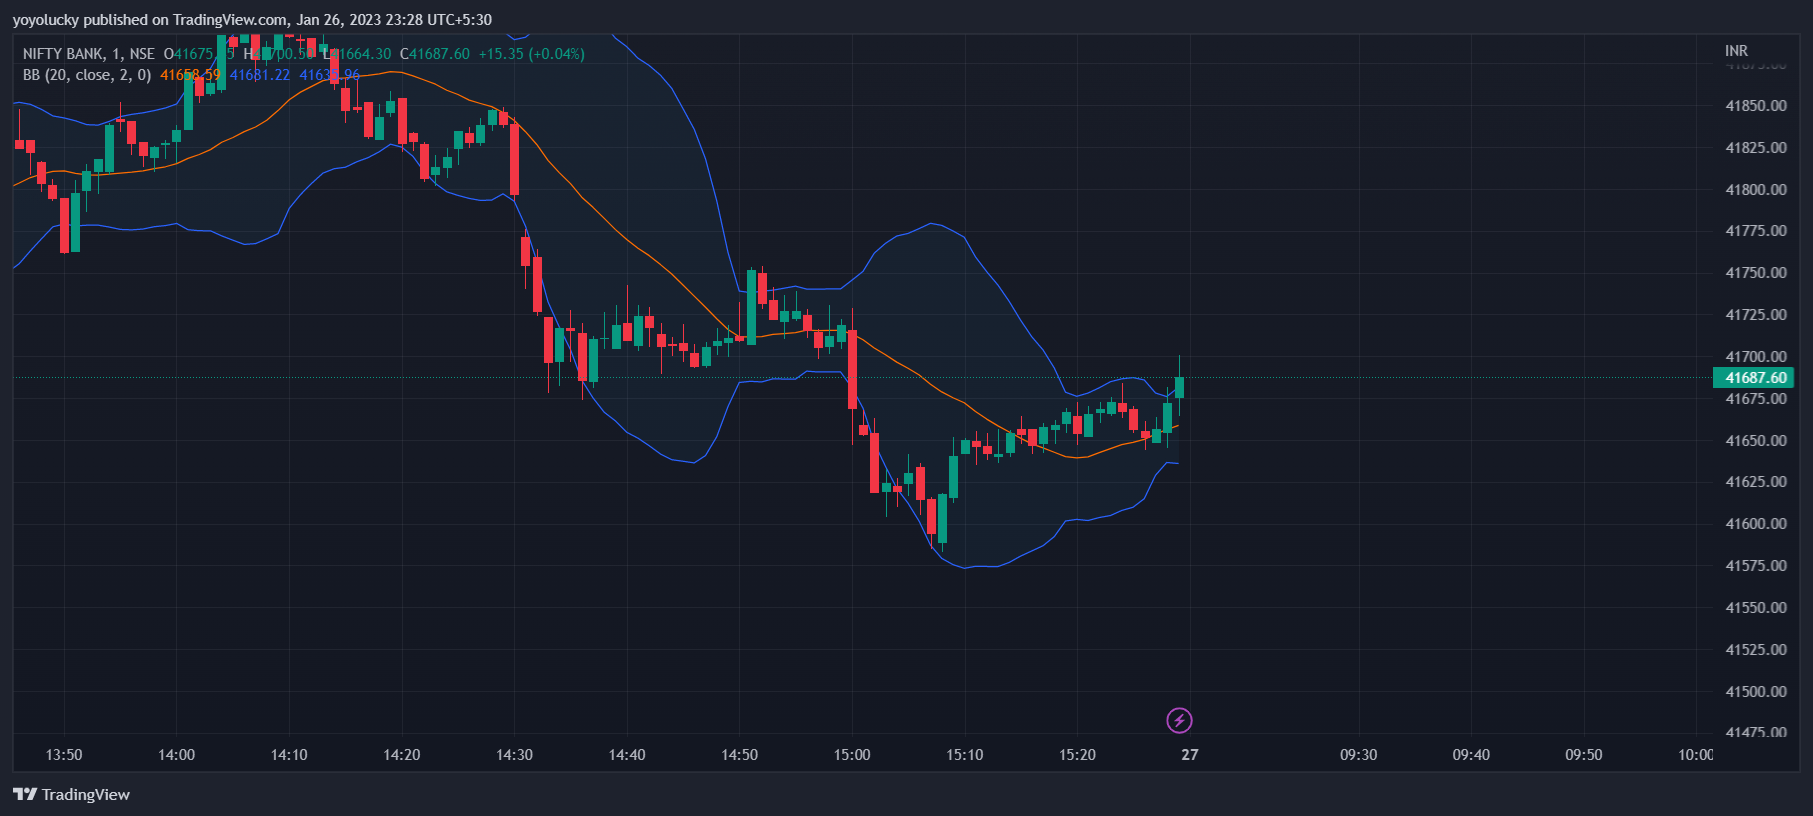
Bollinger Bands are a technical indicator that consists of a moving average and two standard deviation lines. They are used to measure volatility and provide a visual representation of a security's price action.
Trade with Bollinger Bands
Here are a few ways to use Bollinger Bands in intraday trading:
-
Identifying overbought and oversold conditions: Bollinger Bands are typically used to identify overbought and oversold conditions in a security's price. If the price is near the upper band, it is considered to be overbought, and if it is near the lower band, it is considered to be oversold.
-
Crossover signals: A crossover occurs when the price crosses outside of the Bollinger Bands. This can be used as a buy or sell signal.
-
Breakout signals: A breakout occurs when the price breaks outside of the Bollinger Bands. This can also be used as a buy or sell signal.
-
Volatility: Bollinger Bands can also be used to measure volatility by looking at the distance between the upper and lower bands. A wide distance between the bands indicates high volatility, while a narrow distance indicates low volatility.
It's important to note that Bollinger Bands are based on past prices and may not always be accurate in predicting future price movements. Traders should use Bollinger Bands in conjunction with other analysis methods, such as chart patterns and indicators, to confirm trading signals. Also, it's important to adjust the Bollinger Bands parameters according to the security or market conditions to get more accurate results.
What is Stochastic Oscillator?
The Stochastic Oscillator is a momentum indicator that compares the closing price of a security to its price range over a set period of time. It is used to identify overbought and oversold conditions and potential buy and sell signals.
How to trade with Stochastic Oscillator
Here are a few ways to use the Stochastic Oscillator in intraday trading:
-
Overbought and oversold conditions: The Stochastic Oscillator compares the closing price to the high and low of a security over a set period, typically 14 days. If the oscillator is above 80, the security is considered overbought, and if it is below 20, the security is considered oversold.
-
Crossover signals: A bullish crossover occurs when the %K line (the faster line) crosses above the %D line (the slower line). A bearish crossover occurs when the %K line crosses below the %D line.
-
Divergence: Divergence occurs when the Stochastic Oscillator is moving in the opposite direction of the security's price. This can indicate a potential reversal in the trend.
-
Overbought/oversold regions: Traders may also use the Stochastic Oscillator to identify overbought and oversold regions by looking for the %K line to move into the overbought (above 80) or oversold (below 20) regions.
It's important to note that the Stochastic Oscillator works best in trending markets and may not be as reliable in choppy or range-bound markets. It's also important to use the Stochastic Oscillator in conjunction with other analysis methods, such as chart patterns and indicators, to confirm trading signals. And also, it's important to adjust the parameters of the Stochastic Oscillator according to the security or market conditions to get more accurate results.
What is Moving Average Convergence Divergence (MACD)?
The Moving Average Convergence Divergence (MACD) is a trend-following momentum indicator that displays the relationship between two moving averages of a security's price. It is used to identify potential buy and sell signals, as well as changes in the direction of a trend.
How to trade with Moving Average Convergence Divergence (MACD)
Here are a few ways to use the MACD in intraday trading:
-
Crossover signals: A bullish crossover occurs when the MACD line (fast line) crosses above the signal line (slow line). A bearish crossover occurs when the MACD line crosses below the signal line.
-
Divergence: Divergence occurs when the MACD is moving in the opposite direction of the security's price. This can indicate a potential reversal in the trend.
-
Histogram: The histogram is the difference between the MACD line and the signal line. When the histogram is positive, it indicates that the MACD line is above the signal line, and when it is negative, it indicates that the MACD line is below the signal line.
-
Zero line: The zero line is the level where the MACD line and the signal line intersect. If the MACD line is above the zero line, it indicates bullish momentum, and if it is below the zero line, it indicates bearish momentum.
It's important to note that the MACD works best in trending markets and may not be as reliable in choppy or range-bound markets. It's also important to use the MACD in conjunction with other analysis methods, such as chart patterns and indicators, to confirm trading signals. And also, it's important to adjust the parameters of the MACD according to the security or market conditions to get more accurate results.
It's important to note that these indicators should be used in conjunction with other analysis methods, such as chart patterns and fundamental analysis. And also, it's important to test the indicator over a period of time and in different market conditions.